Frequently Asked Questions
If you have any further questions, please contact Dr. Meares.
How much is tuition and how can I pay for it?
Wondering about costs for in-state and out-of-state students? Learn about our MPA Tuition & Fees.
You can finance your education through scholarships, assistantships, fellowships and/or loans. There are both internal and external sources of funding available. The Graduate School offers Graduate Assistantships, and our program offers two scholarships. For more information on assistance, please visit our scholarships and assistantships pages.
Is the MPA program accredited?
 Yes! Our MPA Program is accredited by the Network of Schools for Public Policy, Affairs, and Administration (NASPAA), the global standard in public service education.
Do I have to choose an area of specialization?
No. Many students decide to enroll in elective courses that help advance their career goals. However, our program does offer a Certificate in Nonprofit Leadership and a concentration in criminal justice. For more information, contact Dr. Meares.
How are MPA classes delivered?
The MPA Program offers most courses in the traditional classroom setting. Students have the option to take a limited number of courses in an online or hybrid format. We currently offer all of our core, required courses in the classroom during the evening hours. The program is designed for working professionals.
How long will it take me to complete the MPA degree?
The program consists of 36 hours (12 courses). There are seven required courses (21 hours); an internship for students who lack significant public or nonprofit work experience (3 hours); and four electives courses (12 hours). Students who qualify may receive permission to waive the internship and take an additional elective course. Full-time students take three classes a semester, and they generally complete the internship the summer between their first and second year. The program can be completed in two years with continuous full-time enrollment. If a student elects to enroll part-time, the program can be completed in two and a half years with continuous enrollment.
When students are admitted to the program, the MPA Director will help them plan a schedule for completing the degree.
How many students are in your program?
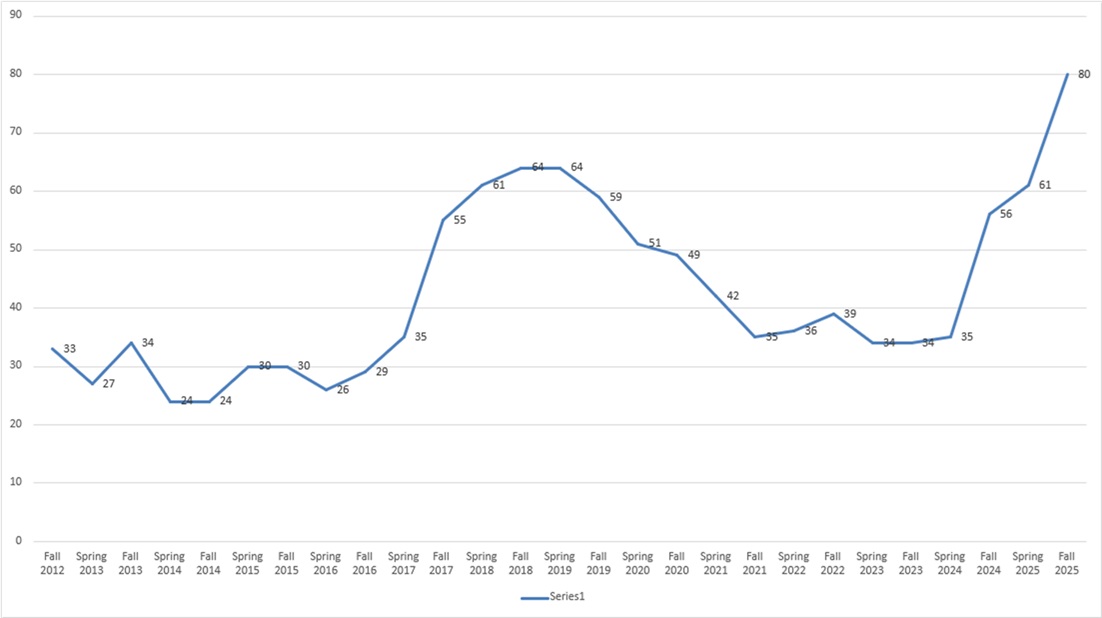
How many enrolled students complete the program?
Historically, most of our students have worked full-time and completed our program by taking two classes per semester. Since 2013, 78 percent of enrolled students have completed the program. Below are the completion rates for two recent cohorts.
Program Completion Numbers and Percentages:
|
|||
| Initially enrolled | Graduated in 2 Years | Graduated within 3 years | Graduated within 4 years |
| 17 | 10 | 12 | 12 |
| 59% | 71% | 71% | |
Program Completion Numbers and Percentages:
|
|||
| Initially enrolled | Graduated in 2 Years | Graduated within 3 years | Graduated within 4 years |
| 22 | 15 | 19 | 19 |
| 68% | 86% | 86% | |
Program Completion Numbers and Percentages:
|
|||
| Initially enrolled | Graduated in 2 Years | Graduated within 3 years | Graduated within 4 years |
| 33 | 24 | 28 | 28 |
| 72% | 84% | 84% | |
Program Completion Numbers and Percentages:
|
|||
| Initially enrolled | Graduated in 2 Years | Graduated within 3 years | Graduated within 4 years |
| 34 | 28 | 31 | 31 |
| 82% | 91% | 91% | |
Program Completion Numbers and Percentages:
|
|||
| Initially enrolled | Graduated in 2 Years | Graduated within 3 years | Graduated within 4 years |
| 29 | 21 | 26 | 26 |
| 72% | 90% | 90% | |
Where do your students go on to work?
Our graduates work in many jobs within public service. The table below presents job placement statistics for MPA graduates from 2012-2017. The employment categories listed are outlined by our accrediting body, the Network of Schools for Public Policy, Affairs, and Administration (NASPAA).
For more detailed information about the program, please review our most recent NASPAA self-study.
Employment Statistics for MPA Graduates, 2017-2024 |
||||||||
| Employment Sectors | 2017-2018 Graduates | 2018-2019 Graduates | 2019-2020 Graduates | 2020-2021 Graduates | 2021-2022 Graduates | 2022-2023 Graduates | 2023-2024 Graduates | 2024-2025 Graduates |
|
National or central government |
0% |
8% |
18% |
0% |
5% |
7% |
0% |
0% |
|
State, provincial or regional government |
27% |
32% |
26% |
32% |
18% |
43% |
33% |
36% |
|
City, county, or other local government |
0% |
16% |
18% |
23% |
32% |
21% |
13% |
0% |
|
Nonprofit domestic-oriented |
27% |
12% |
10% |
18% |
18% |
0% |
20% |
18% |
|
Obtaining further education |
9% |
8% |
10% |
5% |
5% |
7% |
0% |
9% |
|
Military Service |
0% |
0% |
0% |
0% |
0% |
7% |
13% |
18% |
|
Private Sector |
32% |
25% |
13% |
14% |
14% |
0% |
7% |
9% |
|
Status unknown |
0% |
8% |
5% |
9% |
9% |
14% |
14% |
9% |
| Total number | 11 | 25 | 39 | 22 | 22 | 14 | 15 | 11 |